Who will win French elections❓ How will markets react❓
Second round of French presidential elections will be held this Sunday, April 24. As expected, incumbent president Emmanuel Macron and far-right candidate Marine le Pen made it to the second round. Below we present a list of key info ahead of the Sunday's ballot as well as technical analysis for markets that may experience big moves - FRA40, DE30 and EURUSD.
What to focus on?
Start investing today or test a free demo
Open real account TRY DEMO Download mobile app Download mobile app-
Polls show that gap between Macron Le Pen continues to widen with incumbent president having an almost 12% lead now
-
Macron's victory should be seen as a positive for markets. Macron's win is priced in into current high levels on EURUSD as well as FRA40 and DE30
-
High levels on EUR market and European indices signal that upside in case of Macron's victory may be limited. A risk of profit-taking is real
-
On the other hand, Le Pen's win could see some more volatile reactions of the markets, similarly to Brexit referendum or Trump's presidential election win
-
When it comes to France, parliamentary elections scheduled for June will be as important as presidential elections as they will help shape country's future policy
-
Shares of French banks - Societe Generale (GLE.FR), Credit Agricole (ACA.FR) or BNP Paribas (BNP.FR) - may see elevated volatility as they tend to be very reactive to potential changes in EU policy
-
Shares of concession companies like Vinci (DG.FR) or Eiffage (FGR.FR) may also become volatile in the aftermath of elections as Le Pen vowed to nationalize French highways
-
Le Pen promised to boost defense spending if she wins therefer defense companies - Thales (HO.FR) and Dassault Aviation (AM.FR) - will also be on watch on Monday
-
There are some concerns that Le Pen, if elected, may engage in similar trade policies as Trump did, meaning extensive use of tariffs. This creates a risk for French luxury goods companies LVMH (MC.FR) and Kering (KER.FR)
-
While Le Pen has distanced away from its previous anti-EU rhetoric following Russian invasion of Ukraine, she still plans to make changes in the constitution to warrant that national laws have precedence over EU laws
Let's take a look at the DE30, FRA40 and EURUSD charts ahead of the election weekend.
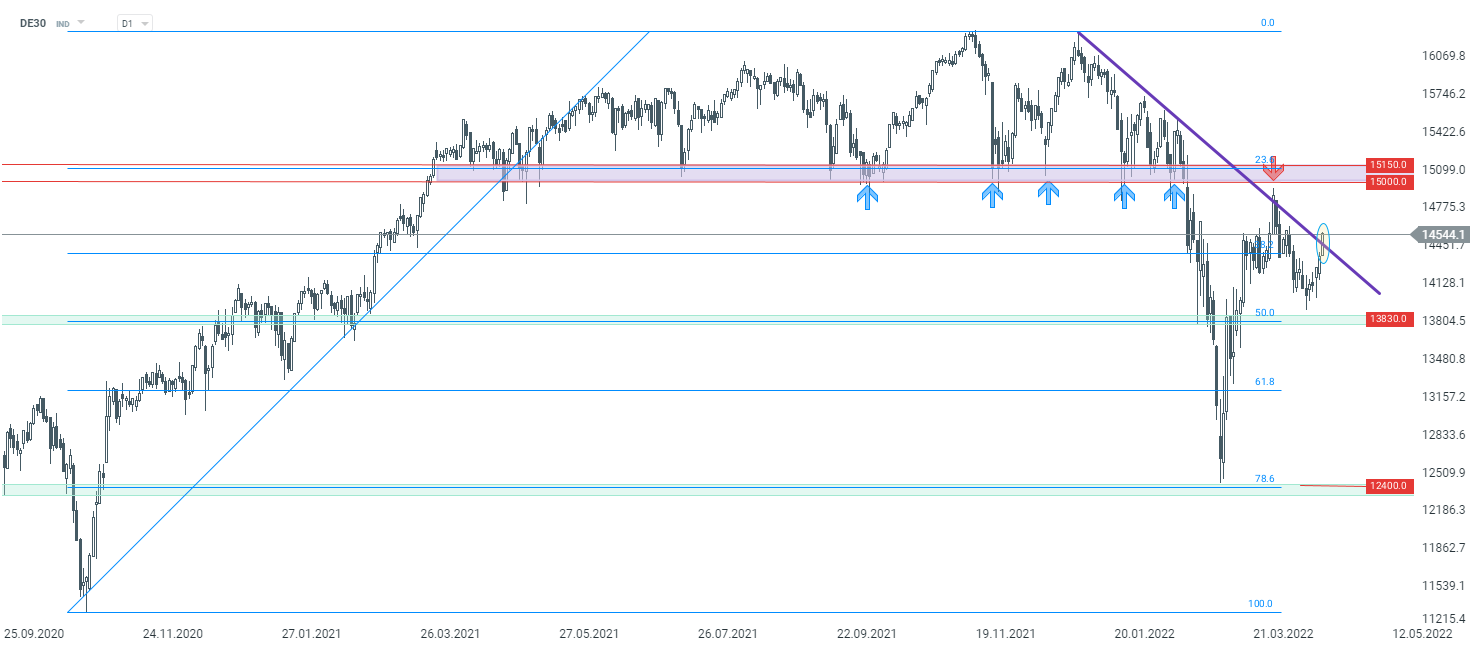
DE30
Taking a look at DE30 at a daily interval, we can see that the sell-off that occurred in late-February has been almost completely erased by now. In spite of a panic sell-off triggered by the Russian invasion of Ukraine, recovery arrived quickly. Nevertheless, price failed to break above the long-term resistance zone ranging between 15,000 and 15,150 pts. A break above this zone would make an outlook more bullish. However, index will need to clear the downward trendline before that happens. Another test of the trendline is being made at press time and another attack on 15,000-15,150 pts area cannot be ruled out if it is successful. On the other hand, a failure to break above the trendline may result in pullback that could push the index back towards the support in the 13,830 pts area.
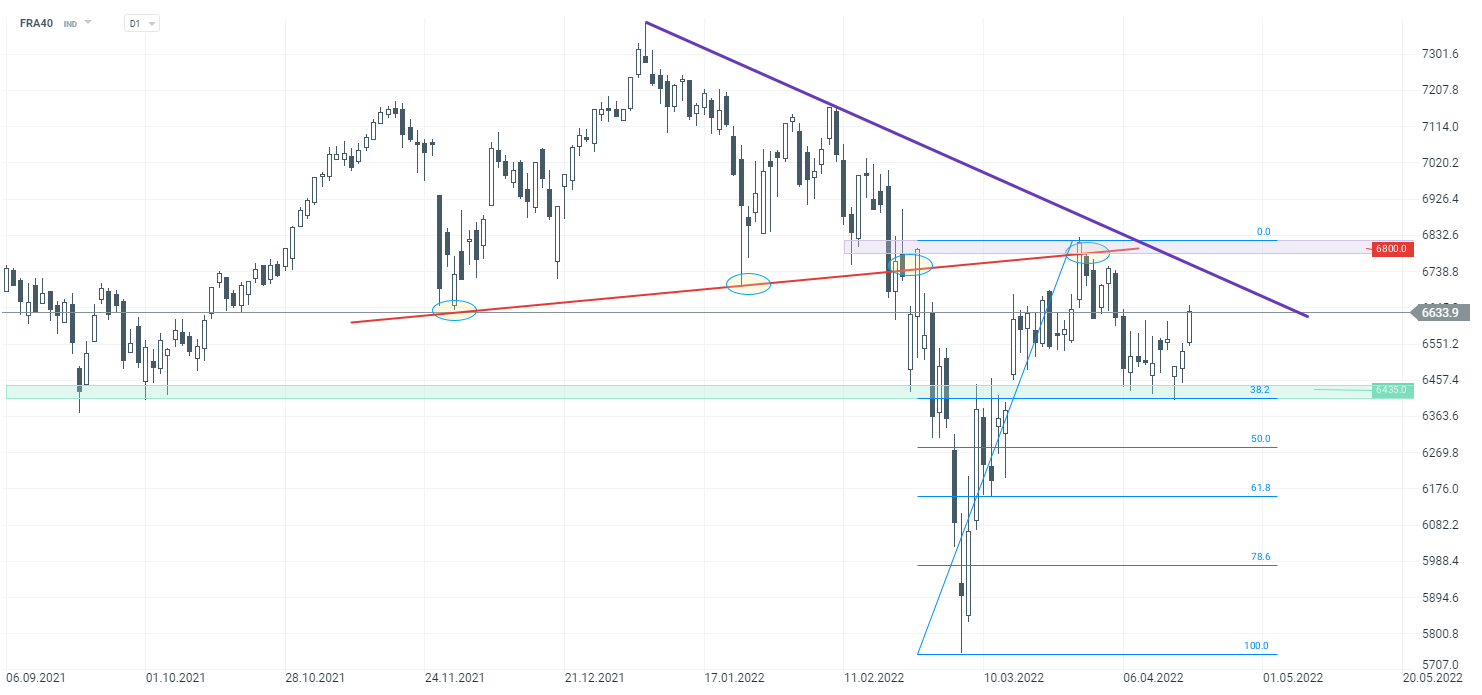
FRA40
When it comes to FRA40, the French index realized the range of the head-and-shoulders formation in textbook manner (which was supported by the outbreak of the war in Ukraine). However panic was quickly contained and the neckline of the aforementioned formation was tested from the other side. Next sellers made another attempt to push the index lower, however the sell-off was halted around support at 6,435 pts, which remains crucial in the short term. As long as price sits above, another upward impulse towards resistance at 6800 pts may be launched. This zone is marked with a neckline of the aforementioned head-and-shoulders pattern, previous price corrections and the downtrend line. A break above this level could see sentiment change to bullish. On the other hand, if sellers manage to break below support at 6,435 pts, a downward move may resume.
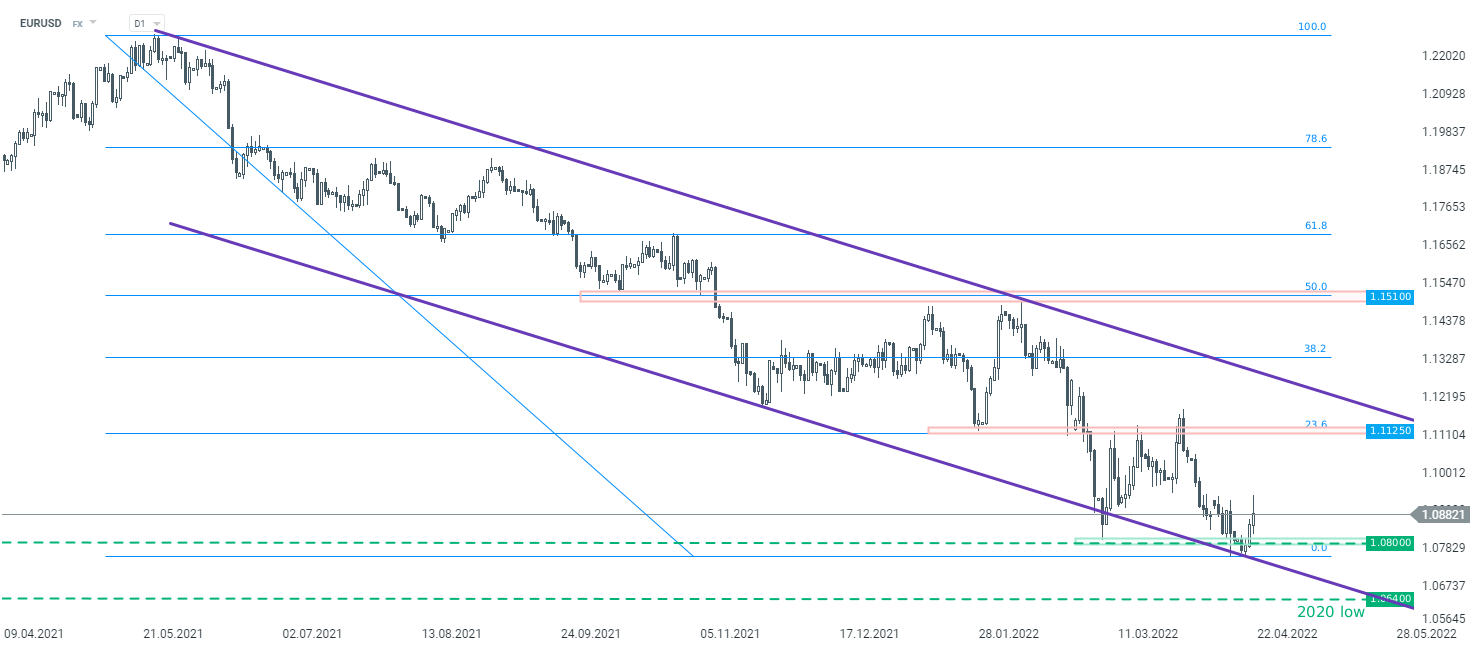
EURUSD
The main currency pair has been moving in a downtrend for a long time. Looking at the D1 interval, one can see that EURUSD is trading in a wide downward channel and the current rebound should be treated as a correction. It seems that only a break above upper limit of the purple channel could see the sentiment change to bullish. Nevertheless, the upward correction may widen, especially that a local double bottom formation emerged around 1.08 level. Considering the bullish scenario, the zone at 1.1125 should be treated as the nearest major resistance, which is marked with earlier price reactions and 23.6% Fibonacci retracement of the entire downward move launched in May 2021. On the other hand, should break below support at 1.0810 occur, the sell-off may accelerate towards 1.0640, where the 2020 lows are located.
The content of this report has been created by XTB S.A., with its registered office in Warsaw, at Prosta 67, 00-838 Warsaw, Poland, (KRS number 0000217580) and supervised by Polish Supervision Authority ( No. DDM-M-4021-57-1/2005). This material is a marketing communication within the meaning of Art. 24 (3) of Directive 2014/65/EU of the European Parliament and of the Council of 15 May 2014 on markets in financial instruments and amending Directive 2002/92/EC and Directive 2011/61/EU (MiFID II). Marketing communication is not an investment recommendation or information recommending or suggesting an investment strategy within the meaning of Regulation (EU) No 596/2014 of the European Parliament and of the Council of 16 April 2014 on market abuse (market abuse regulation) and repealing Directive 2003/6/EC of the European Parliament and of the Council and Commission Directives 2003/124/EC, 2003/125/EC and 2004/72/EC and Commission Delegated Regulation (EU) 2016/958 of 9 March 2016 supplementing Regulation (EU) No 596/2014 of the European Parliament and of the Council with regard to regulatory technical standards for the technical arrangements for objective presentation of investment recommendations or other information recommending or suggesting an investment strategy and for disclosure of particular interests or indications of conflicts of interest or any other advice, including in the area of investment advisory, within the meaning of the Trading in Financial Instruments Act of 29 July 2005 (i.e. Journal of Laws 2019, item 875, as amended). The marketing communication is prepared with the highest diligence, objectivity, presents the facts known to the author on the date of preparation and is devoid of any evaluation elements. The marketing communication is prepared without considering the client’s needs, his individual financial situation and does not present any investment strategy in any way. The marketing communication does not constitute an offer of sale, offering, subscription, invitation to purchase, advertisement or promotion of any financial instruments. XTB S.A. is not liable for any client’s actions or omissions, in particular for the acquisition or disposal of financial instruments, undertaken on the basis of the information contained in this marketing communication. In the event that the marketing communication contains any information about any results regarding the financial instruments indicated therein, these do not constitute any guarantee or forecast regarding the future results.