- Lockheed Martin gained after launch of Israel-Hamas war
- Company reported Q3 earnings on Tuesday
- Sales beat expectations while operating profit lags
- Lower sales in F-35 program weigh on results
- Backlog of orders increased 12% YoY
- Stock bounces over 12% off early-October lows
Lockheed Martin (LMT.US), US defense & aerospace company, has been enjoying strong gains as of late, bouncing over 12% off the early-October lows. Move higher is driven primarily by an increase in tensions in the Middle East. However, the earnings report for Q3 2023 released this week also played a role. Let's take a look at the company's earnings as well as its valuation!
Lockheed Martin with mixed Q3 earnings
Kezdjen befektetni még ma, vagy próbálja ki ingyenes demónkat
Élő számla regisztráció DEMÓ SZÁMLA Mobil app letöltése Mobil app letöltéseLockheed Martin (LMT.US) reported Q3 2023 earnings on Tuesday before opening of the Wall Street cash session. Report can be best described as mixed with sales coming in slightly above expectations and operating profit missing estimates slightly. A revenue drop in key Aeronautics unit is concerning and the company explained that it was due to lower net sales in the F-35 program, which resulted from lower volume of production contracts and parts shortages. Backlog of orders increased 12% YoY, to $156 billion. Big beats were spotted in operating cash flow as well as free cash flow. When it comes to full-year guidance, company decided to keep it unchanged.
Q3 2023 earnings
- Net sales: $16.88 billion vs $16.76 billion expected (+1.8% YoY)
- Missiles & Fire Control: $2.94 billion vs $2.89 billion expected (+3.8% YoY)
- Aeronautics: $6.72 billion vs $6.82 billion expected (-5.2% YoY)
- Rotary & Mission Systems: $4.12 billion vs $3.96 billion expected (+9% YoY)
- Space: $3.10 billion vs $3.05 billion expected (+7.6% YoY)
- Operating profit: $2.04 billion vs $2.09 billion expected (-5.4% YoY)
- Missiles & Fire Control: $398 million vs $375.1 million expected (+4.2% YoY)
- Aeronautics: $671 million vs $708.7 million expected (-12% YoY)
- Rotary & Mission Systems: $482 million vs $490.5 million expected (+16% YoY)
- Space: $259 million vs $274.3 million expected (-14% YoY)
- Adjusted EPS: $6.77 vs $6.67 expected (-1.5% YoY)
- Cash flow from operations: $2.89 billion vs $2.39 billion expected (-7.7% YoY)
- Free cash flow: $2.53 billion vs $1.93 billion expected (-7.4% YoY)
- Backlog: $156.03 billion (+12% YoY)
Full-year guidance
- EPS: $27.00-27.20 (exp. $27.15)
- Cash flow from operations: $8.15 billion
- Capital expenditures: $1.95 billion
- Net sales: $66.25-66.75 billion
- Free cash flow: 'at least' $6.20 billion
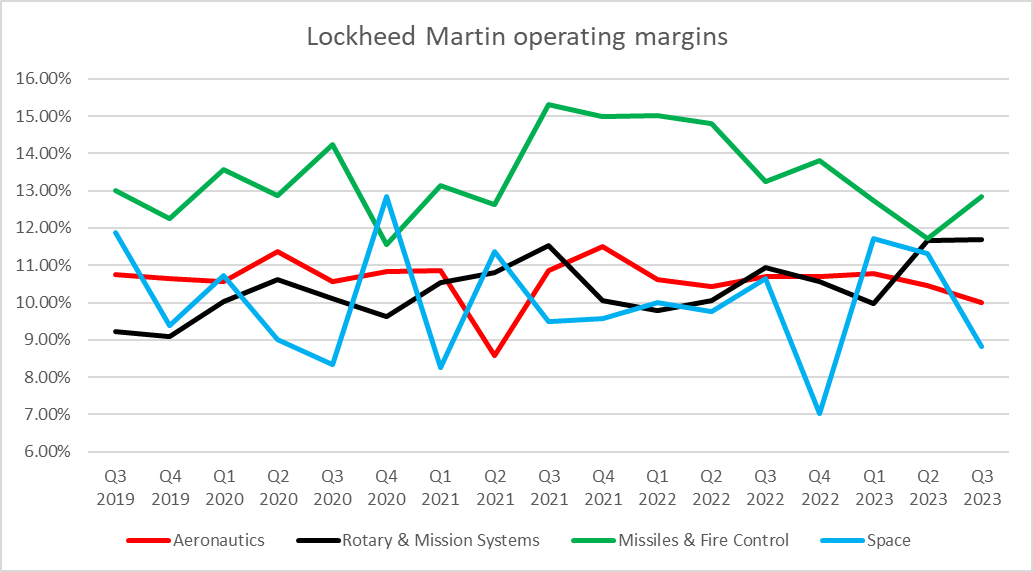 Lockheed Martin experienced a drop in operating margins in Aeronautics and Space units in Q3 2023. Source: Bloomberg Finance LP, XTB
Middle East tensions support Lockheed's share price
As a major defense company, shares of Lockheed Martin are sensitive to geopolitical developments. Company's share price gained after the launch of the Russian invasion of Ukraine in early-2022 and has also experienced a jump last week, following the launch of the Israel-Hamas war. Increasing number of military conflicts around the world is leading to a trend of increased defense spending and it should support the business of defense companies going forward. This is especially true for Lockheed Martin as it is the largest US military contractor and received contracts from the US Department of Defense worth $46 billion in 2022.
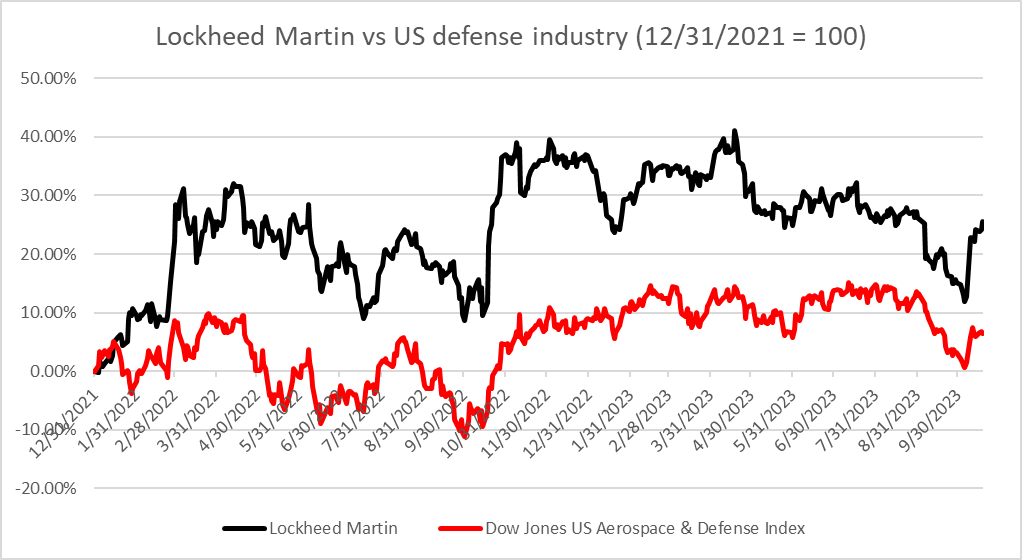 Lockheed Martin has been outperforming Dow Jones US Aerospace & Defense index throughout 2022 and 2023. Source: Bloomberg Finance LP, XTB
Valuation
Let's take a quick look at Lockheed Martin's valuation with 3 often used valuation methods - DCF, multiples and Gordon Growth Model. We want to stress that those valuations are for presentation purposes only and should not be viewed as recommendations or target prices.
Discounted Cash Flow method
Let's begin our look at Lockheed Martin's valuation with the most in-depth of the three aforementioned models - Discounted Cash Flow method (DCF). This model relies on a number of assumptions. We have decided to take a simplified approach and base those assumptions on averages for the past 5-years. Detailed forecasts for 10 years were made with terminal value assumptions being set as follows - 3% terminal revenue growth and 8% terminal weighted cost of capital (WACC). Such a set of assumptions provides us with the intrinsic value of Lockheed Martin's shares of $605.56 per share - over 30% above current market price!
A point to note is that the intrinsic value obtained via DCF method is highly sensitive to assumptions made. Two sensitivity matrices are provided below - one for different sets of Operating Margin and Revenue Growth assumptions and the other for different sets of Terminal WACC and Terminal Revenue Growth assumptions.
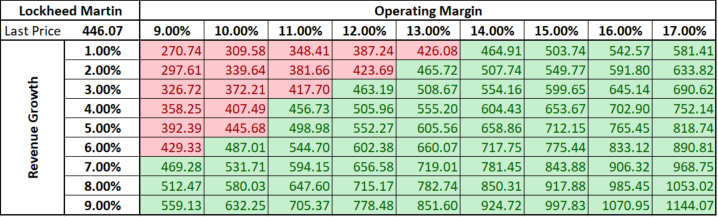
Source: Bloomberg Finance LP, XTB
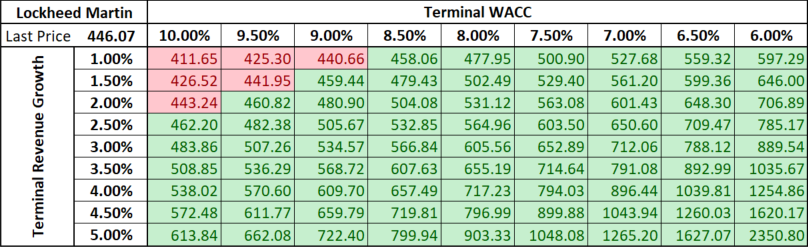
Source: Bloomberg Finance LP, XTB
Multiples
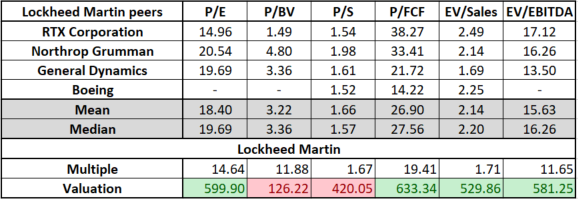
Next, let's take a closer look at what peer multiples tell us about Lockheed Martin's valuation. We have constructed a peer group with US companies that are seen as competitors to Lockheed in the defense industry. The group includes: RTX Corporation (RTX.US), Northrop Gruman (NOC.US), General Dynamics (GD.US) and Boeing (BA.US). We have taken a look at 6 different valuation multiples - P/E, P/BV, P/S, P/FCF, EV/Sales and EV/EBITDA.
As we can see in the table below, there is quite high volatility in multiples for different companies. As such, we have decided to base calculations of Lockheed Martin valuation on medians rather than means. One shortcoming of multiple analysis for Lockheed Martin is that the peer group is quite small. One company from the group (Boeing) has been unprofitable as of late and therefore multiples like P/E or EV/EBITDA cannot be calculated. Nevertheless, using obtained medians we are provided with a Lockheed Martin's valuations ranging from as low as $126.22 in case of P/BV multiple to as high as $633.34 in case of P/FCF multiple. Calculating trimmed mean of the 6 obtained valuations (mean excluding the highest and the lowest valuations) provides us with an intrinsic value of Lockheed Martin's shares of $532.77 - or almost 20% above yesterday's closing price.
Source: Bloomberg Finance LP, XTB
Gordon Growth Model
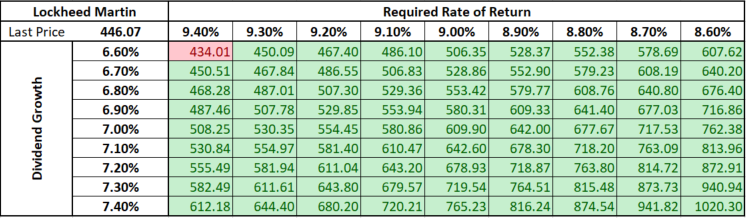
Last but not least, let's take a look at the Gordon Growth Model, which is a valuation method based on dividends. Lockheed Martin (LMT.US) has been paying out dividends for over 30 years and payouts have been increased each year since 2002. Such a long and strong track record of dividend payouts makes Lockheed a good company for valuation with the Gordon Growth Model. We have assumed a 7% dividend growth rate as well as 9% required rate of return based on averages and trends for the past 5-years. Running a model with such assumptions leads us to an intrinsic value of $609.90 per share. This is over 35% above yesterday's closing price.
As it is usually the case with valuation models, the Gordon Growth Model is also highly sensitive to assumptions made. However, noticeable cuts to dividend growth assumption and noticeable hikes to required rate of return assumption would be needed to push the intrinsic value below current market prices (red color in the matrix below).
 Source: Bloomberg Finance LP, XTB
A look at the chart
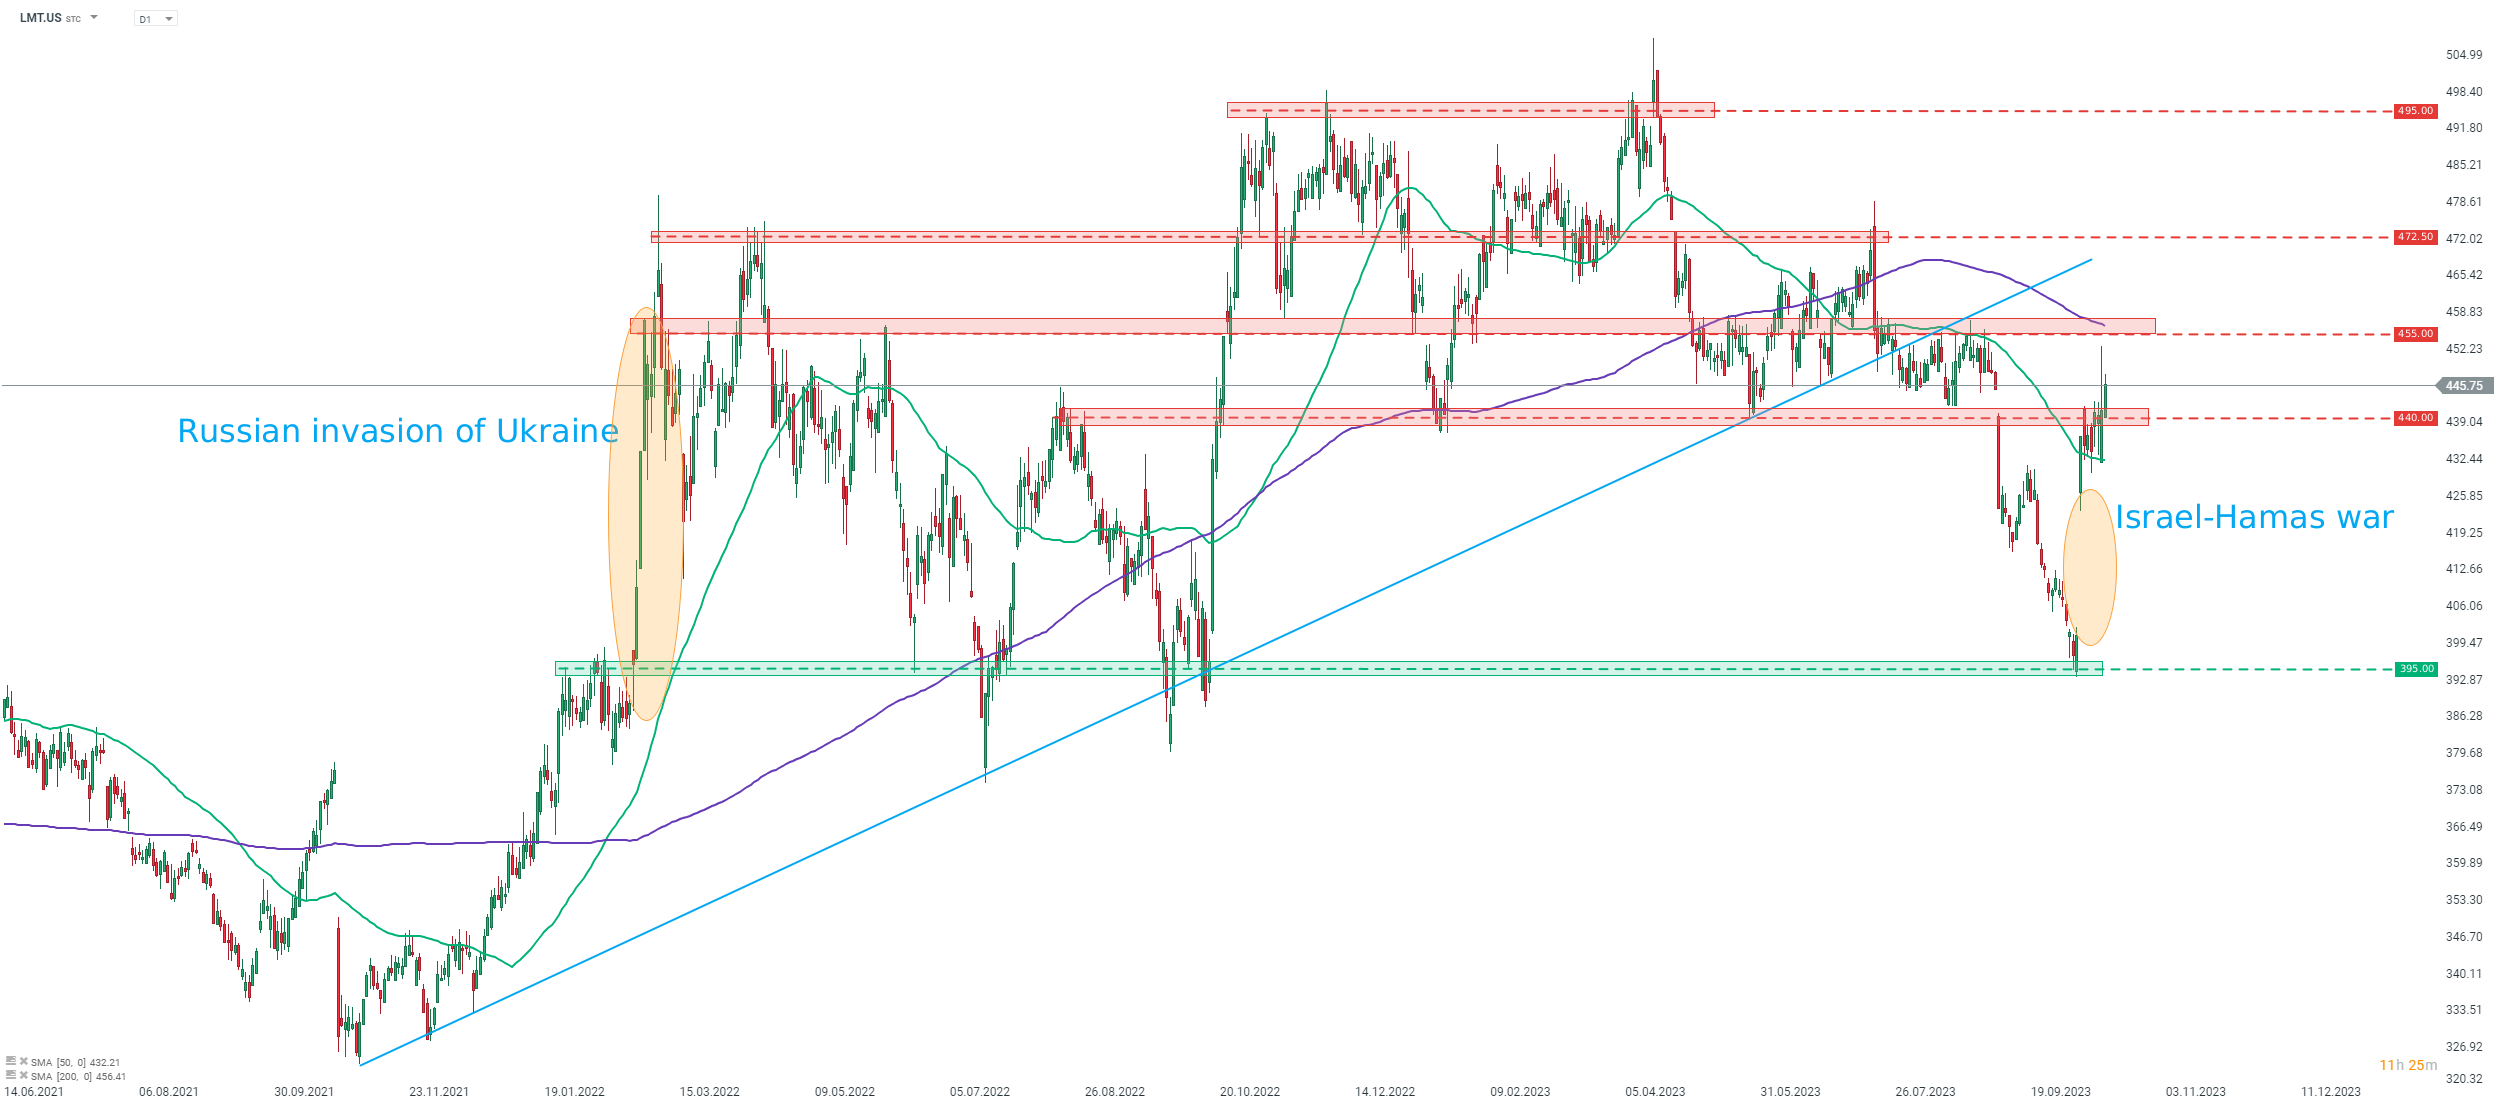
Taking a look at Lockheed Martin (LMT.US) chart at D1 interval, we can see that the stock has been trading in a strong upward move since the beginning of the previous week, following the launch of Israel-Hamas war. Stock broke above $440 resistance zone yesterday and booked the highest close since early-September 2023. Given the escalating situation in the Middle East, one cannot rule out that defense companies will remain in investors' favor. Near-term resistance zone to watch can be found ranging above the $455 area and is marked with previous price reaction as well as the 200-session moving average (purple line).
 Source: xStation5
Ezen tartalmat az XTB S.A. készítette, amelynek székhelye Varsóban található a következő címen, Prosta 67, 00-838 Varsó, Lengyelország (KRS szám: 0000217580), és a lengyel pénzügyi hatóság (KNF) felügyeli (sz. DDM-M-4021-57-1/2005). Ezen tartalom a 2014/65/EU irányelvének, ami az Európai Parlament és a Tanács 2014. május 15-i határozata a pénzügyi eszközök piacairól , 24. cikkének (3) bekezdése , valamint a 2002/92 / EK irányelv és a 2011/61 / EU irányelv (MiFID II) szerint marketingkommunikációnak minősül, továbbá nem minősül befektetési tanácsadásnak vagy befektetési kutatásnak. A marketingkommunikáció nem befektetési ajánlás vagy információ, amely befektetési stratégiát javasol a következő rendeleteknek megfelelően, Az Európai Parlament és a Tanács 596/2014 / EU rendelete (2014. április 16.) a piaci visszaélésekről (a piaci visszaélésekről szóló rendelet), valamint a 2003/6 / EK európai parlamenti és tanácsi irányelv és a 2003/124 / EK bizottsági irányelvek hatályon kívül helyezéséről / EK, 2003/125 / EK és 2004/72 / EK, valamint az (EU) 2016/958 bizottsági felhatalmazáson alapuló rendelet (2016. március 9.) az 596/2014 / EU európai parlamenti és tanácsi rendeletnek a szabályozási technikai szabályozás tekintetében történő kiegészítéséről a befektetési ajánlások vagy a befektetési stratégiát javasló vagy javasló egyéb információk objektív bemutatására, valamint az egyes érdekek vagy összeférhetetlenség utáni jelek nyilvánosságra hozatalának technikai szabályaira vonatkozó szabványok vagy egyéb tanácsadás, ideértve a befektetési tanácsadást is, az A pénzügyi eszközök kereskedelméről szóló, 2005. július 29-i törvény (azaz a 2019. évi Lap, módosított 875 tétel). Ezen marketingkommunikáció a legnagyobb gondossággal, tárgyilagossággal készült, bemutatja azokat a tényeket, amelyek a szerző számára a készítés időpontjában ismertek voltak , valamint mindenféle értékelési elemtől mentes. A marketingkommunikáció az Ügyfél igényeinek, az egyéni pénzügyi helyzetének figyelembevétele nélkül készül, és semmilyen módon nem terjeszt elő befektetési stratégiát. A marketingkommunikáció nem minősül semmilyen pénzügyi eszköz eladási, felajánlási, feliratkozási, vásárlási felhívásának, hirdetésének vagy promóciójának. Az XTB S.A. nem vállal felelősséget az Ügyfél ezen marketingkommunikációban foglalt információk alapján tett cselekedeteiért vagy mulasztásaiért, különösen a pénzügyi eszközök megszerzéséért vagy elidegenítéséért. Abban az esetben, ha a marketingkommunikáció bármilyen információt tartalmaz az abban megjelölt pénzügyi eszközökkel kapcsolatos eredményekről, azok nem jelentenek garanciát vagy előrejelzést a jövőbeli eredményekkel kapcsolatban.