Russia-Ukraine conflict is being even more closely watched by investors after Putin recognized the independence of the Donetsk People's Republic and Luhansk People's Republic yesterday. The Russian RTS index plunged over 13% yesterday and has opened another 8% lower today. Part of the losses was erased already but the index continues to trade 5% lower on the day. Investors expect severe sanctions to be levied on Russia by the United States, Japan, the United Kingdom and the European Union so it may not be an end of RTS weakness. In any case, traders can expect the index to remain volatile in the coming days.
Taking a look at the Russian RTS chart (RUS50) at weekly interval, we can see that the index is approaching a key support level at 1,040 pts, following a break below the 200-week moving average (purple line). This area is marked not only with a low from early-November 2020 but also with the lower limit of the Overbalance structure. This structure marks the range of a 2020 pandemic drop and a break below would be a strong bearish signal according to the Overbalance methodology.
Start investing today or test a free demo
Open real account TRY DEMO Download mobile app Download mobile app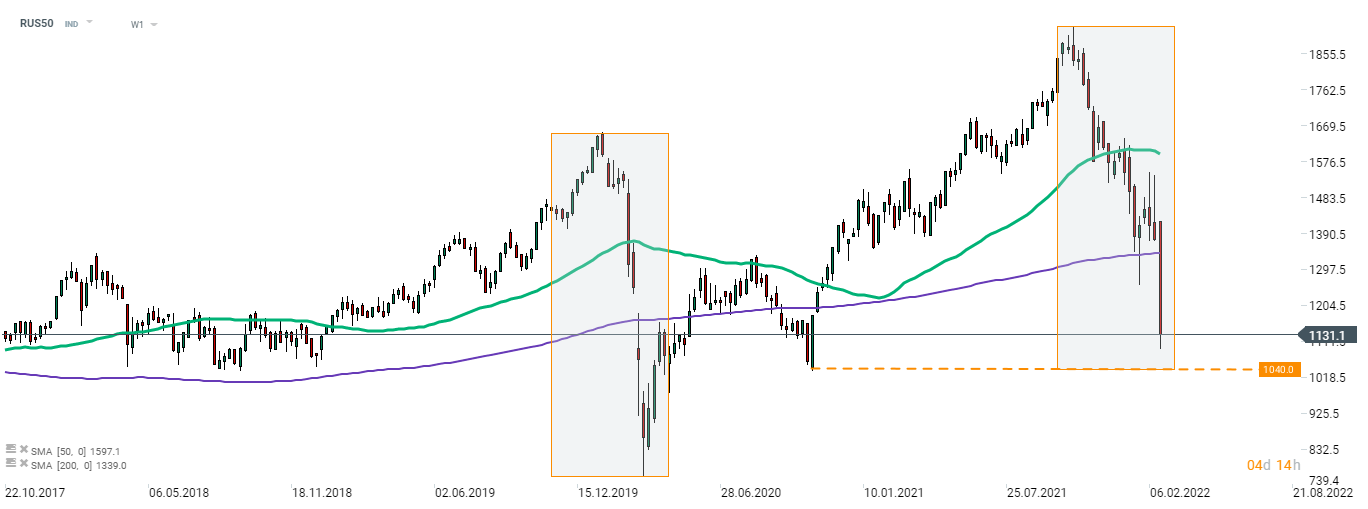 Source: xStation5