Chart of the day - RUS50 (26.03.2021)

8:44 AM March 26, 2021

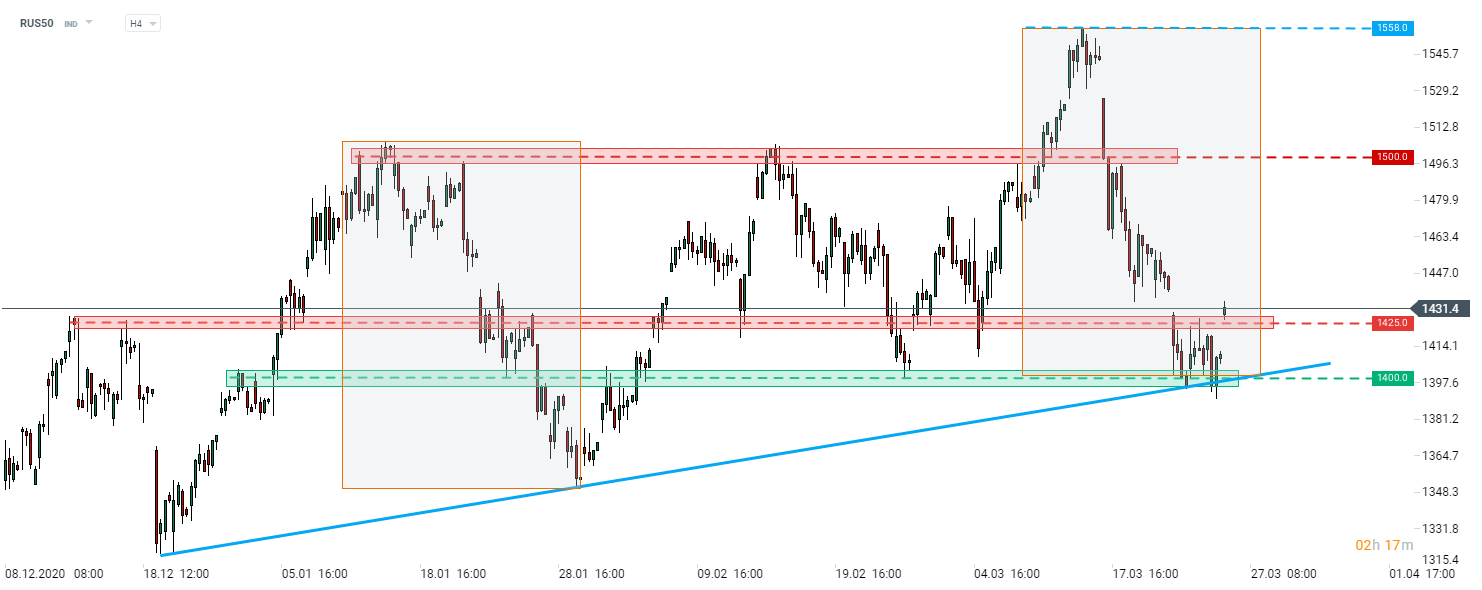
Russian RTS index (RUS50) dropped more than 10% from a recent post-pandemic high at 1,558 pts amid plunge in oil prices. However, the index has found support in the 1,400 pts area as oil prices stabilized. The area is marked with the lower limit of a market geometry, previous price reactions and the upward trendline. RUS50 is bouncing off the area today, thanks to a 2% jump in oil prices. Index launched today's trading above the short-term swing level at 1,425 pts and may now look towards the 1,500 pts area marked with the mid-January and mid-February highs. As the Suez Canal remains blocked, fundamental favours higher oil prices and is in turn beneficial to RUS50 as well.

Source: xStation5

Start investing today or test a free demo

Open real account TRY DEMO Download mobile app Download mobile app
Share:
Back
Xtb logo

Join over 847 000 XTB Group Clients from around the world

Forex and CFDs are leveraged products and can result in losses that exceed your deposits. Please make sure you fully understand all risks.
This page was not created for investors residing in Brazil. This brokerage is not authorized by the Comissão de Valores Mobiliários (CVM) or the Brazilian Central Bank (BCB). The content of this page should not be characterized as an investment offer in Brazil or for investors residing in that country.

Losses can exceed deposits

r('style', 'transform: translateY(-' + (jQuery('.js-warnings').height() - 15) + 'px) !important'); }); }