Contracts based on the Nasdaq-100 technology index (US100) are extending today's early European session dynamic declines, which with their range now reach a key checkpoint, which is the 200-day exponential moving average (golden curve).
Today's session for the technology benchmark could be crucial. This is due to today's scheduled GDP report from the US, which, given market uncertainty over the specter of a US recession, could be a major defining factor in whether the Fed will complete its hike cycle, and whether it will possibly do so while business momentum continues to improve. Market forecasts are good, with the indicator expected to show GDP growth of 4.3% y/y, up from an earlier reading of 2.1%.
The US100 has already fallen more than 10% since its recent highs, recorded in the second half of July 2023, which is framed as a technical correction. However, it is worth noting that the market has seen elevated volumes over the past few sessions, which may indicate the activation of more capital in the market.
At the moment, the key zone to watch is the previously mentioned 200-day moving average. If the benchmark breaks below this zone, the next zones of potential defence may only be the psychological levels of 14,000 points. On the other hand, an upward breakout could encourage the buyers' side to test the 14,700-point zone.
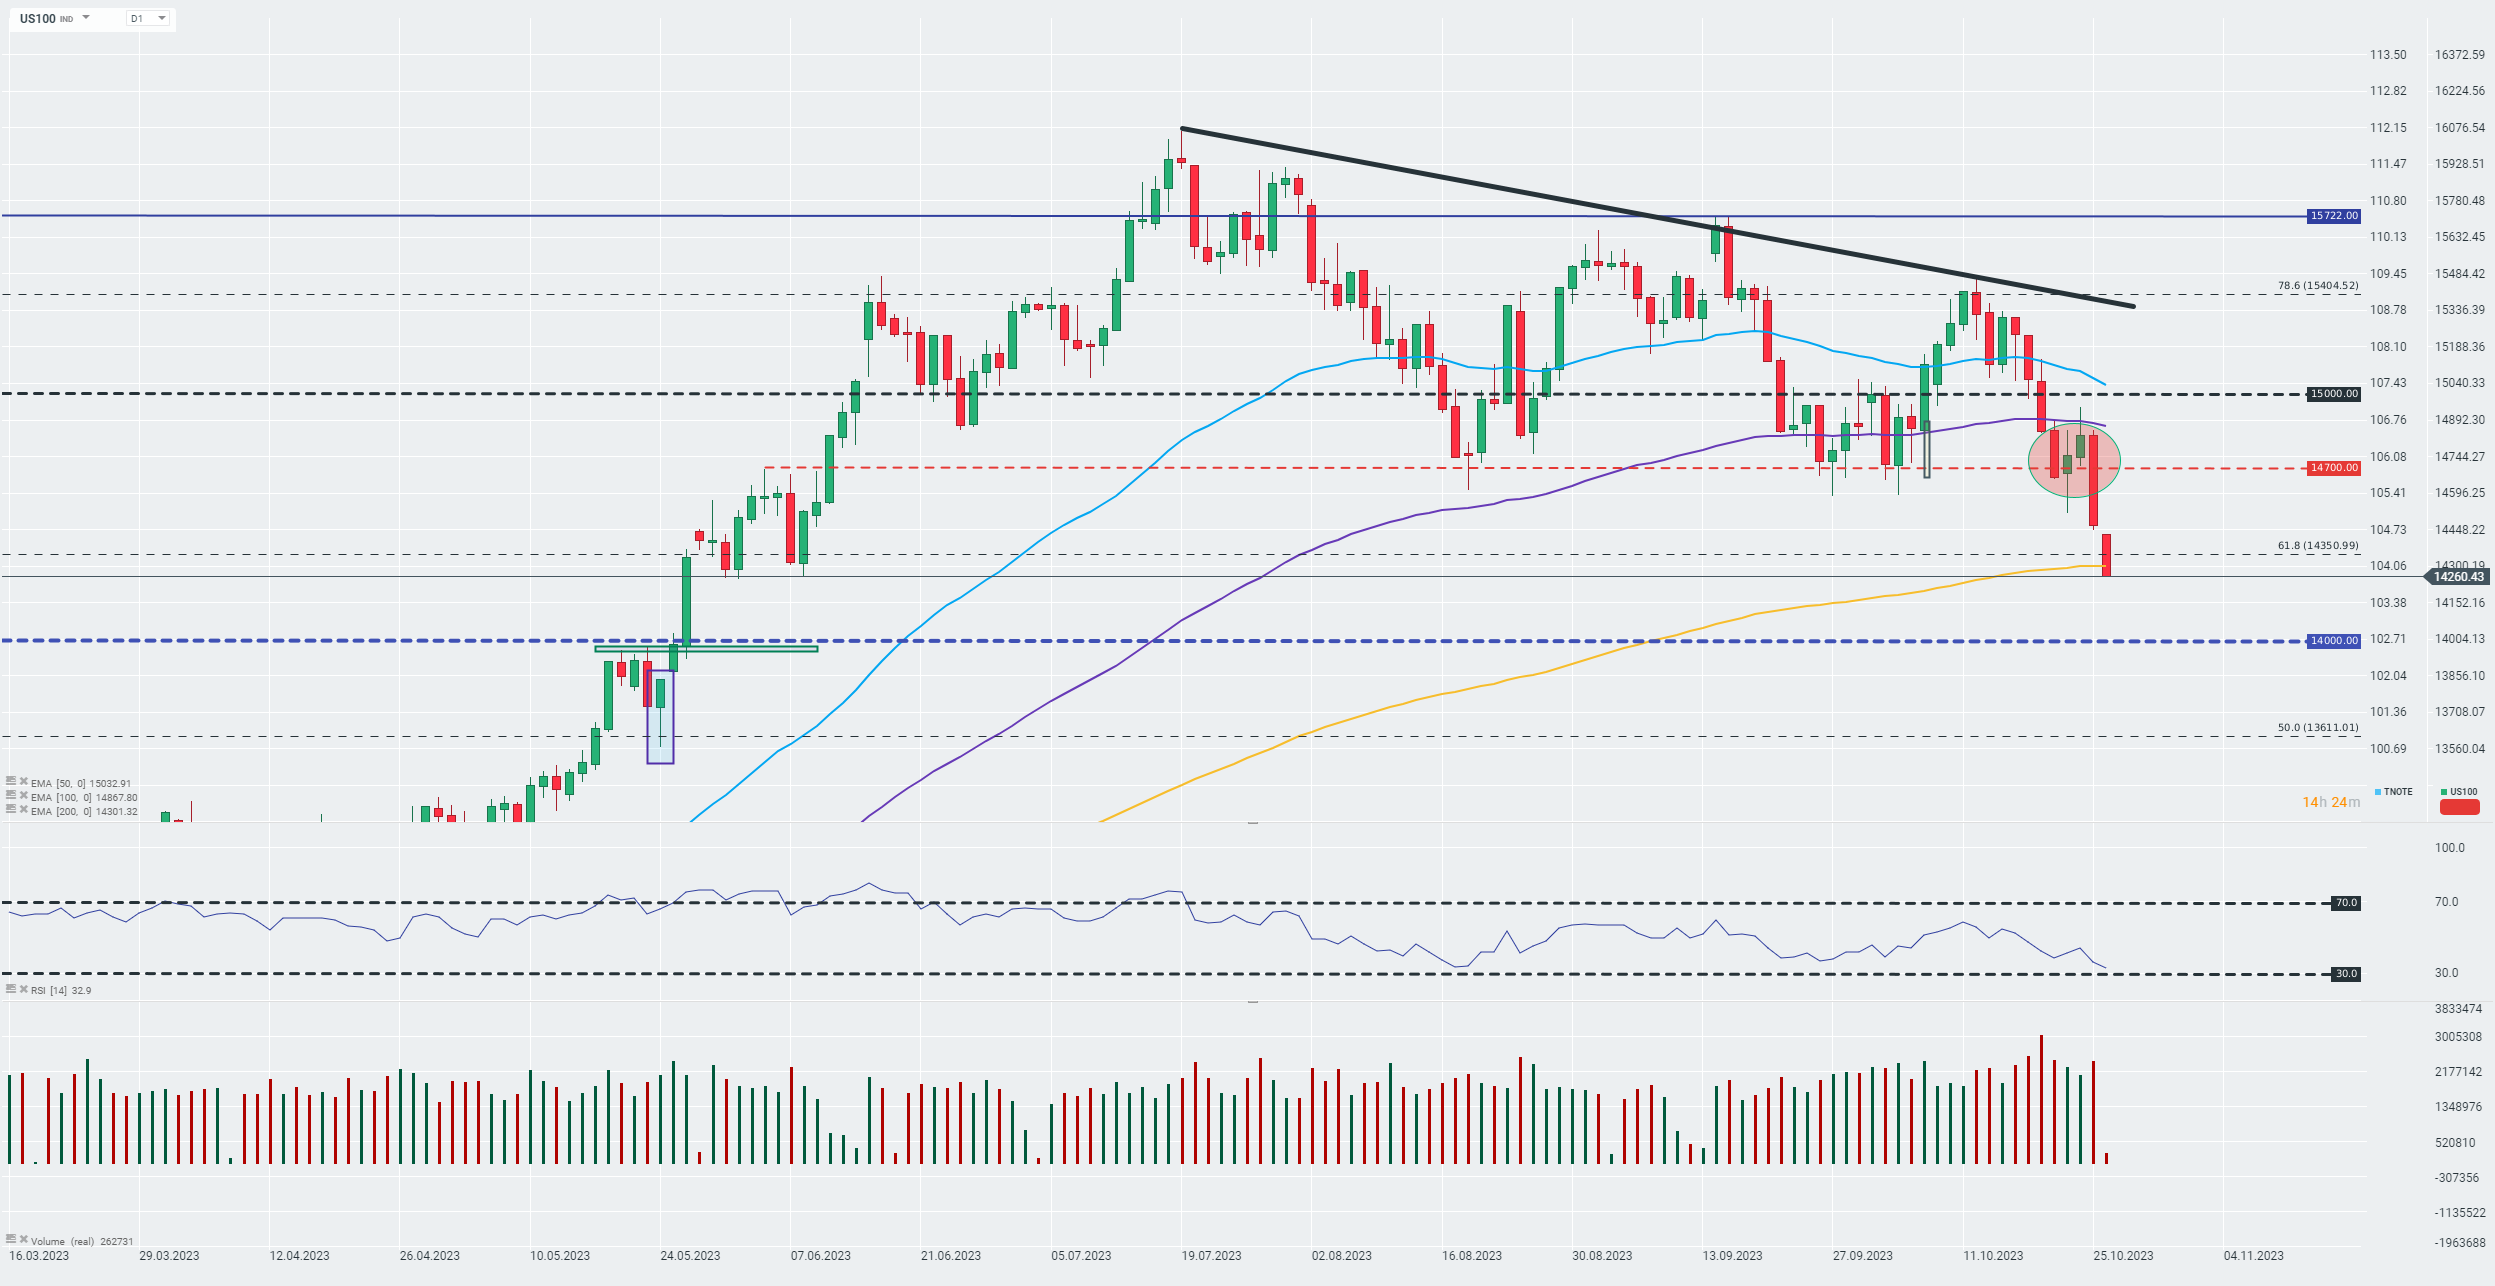
Source: xStation